All features
Statistics and tracking

Know exactly who is interested. And when to call them

Every open, click and reply is counted. Colldly shows you which campaign works, which subject line wins the A/B test and which company is reading your email for the third time. That one is ready for a call.

7 min read·4 chapters·5 questions
colldly.com/dashboard
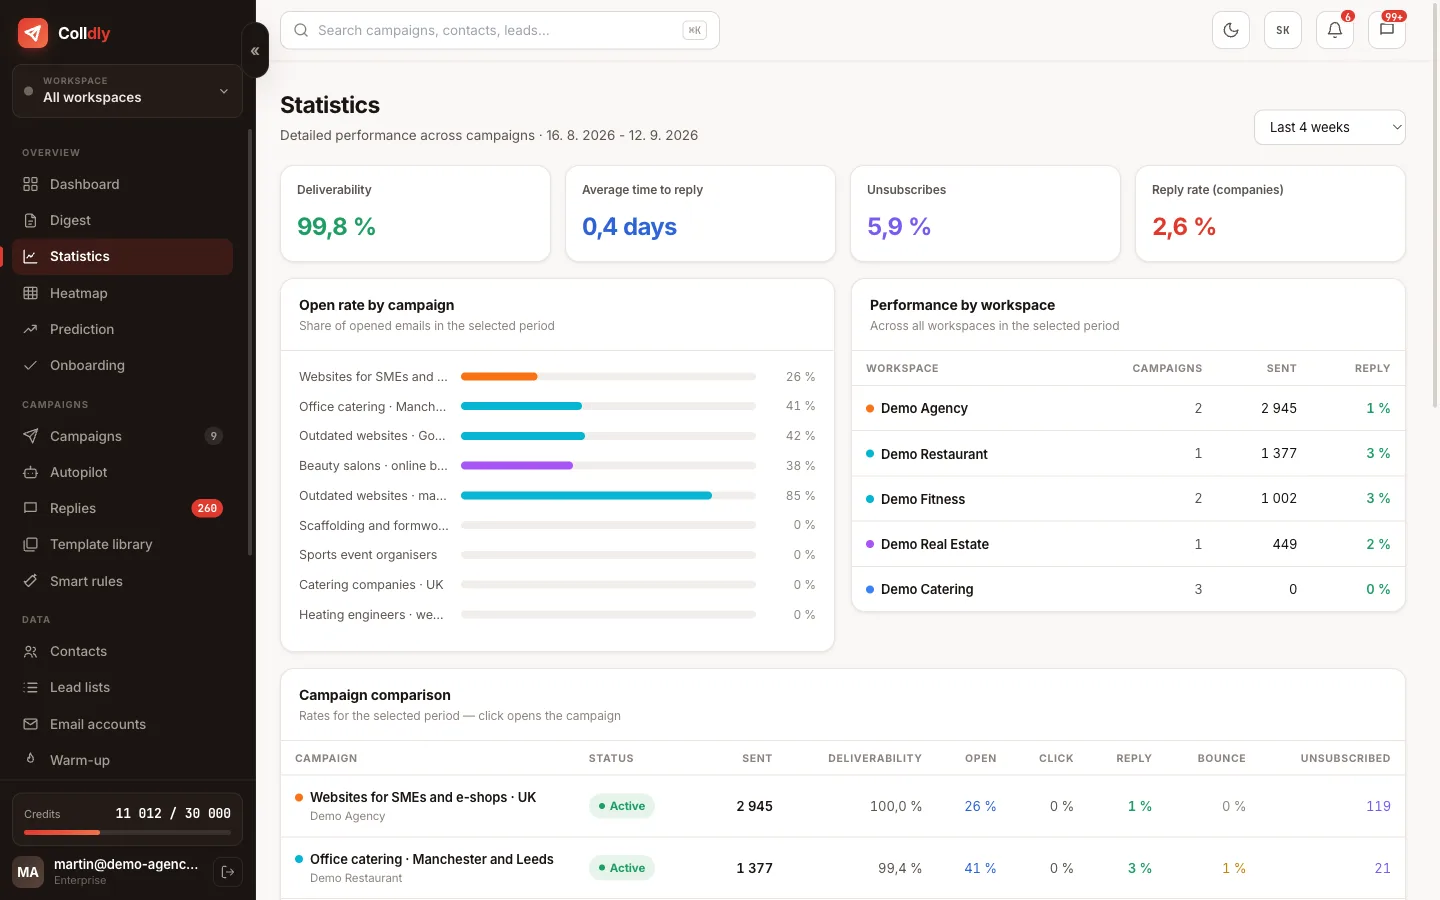
Campaign statistics in Colldly

Statistics in cold email are not there to make you happy but to tell you what to change. Most tools show colourful charts and leave you guessing what to do with them. The interesting question is which number means which action.

Colldly measures four things that can be influenced, delivery, opens, clicks and replies, and shows them in a context that leads to a concrete decision.

Which number means what

The order in which it pays to look at them.
Bounce rate: deal with it immediately
Under three percent is healthy. Above five, stop the campaign and clean the list, otherwise you damage the domain. This is the one number that cannot wait.
Open rate: speaks about the subject line
Above forty percent is solid, above sixty excellent. A low value means a weak subject line or a deliverability problem.
Reply rate: the main metric
A good campaign reaches three to ten percent. Unlike opens it cannot be distorted, so decide by it first.
Clicks: warm contacts
Whoever clicked showed interest even without replying. They are the best candidates for a call or a more personal follow-up.
colldly.com/dashboard › Statistics
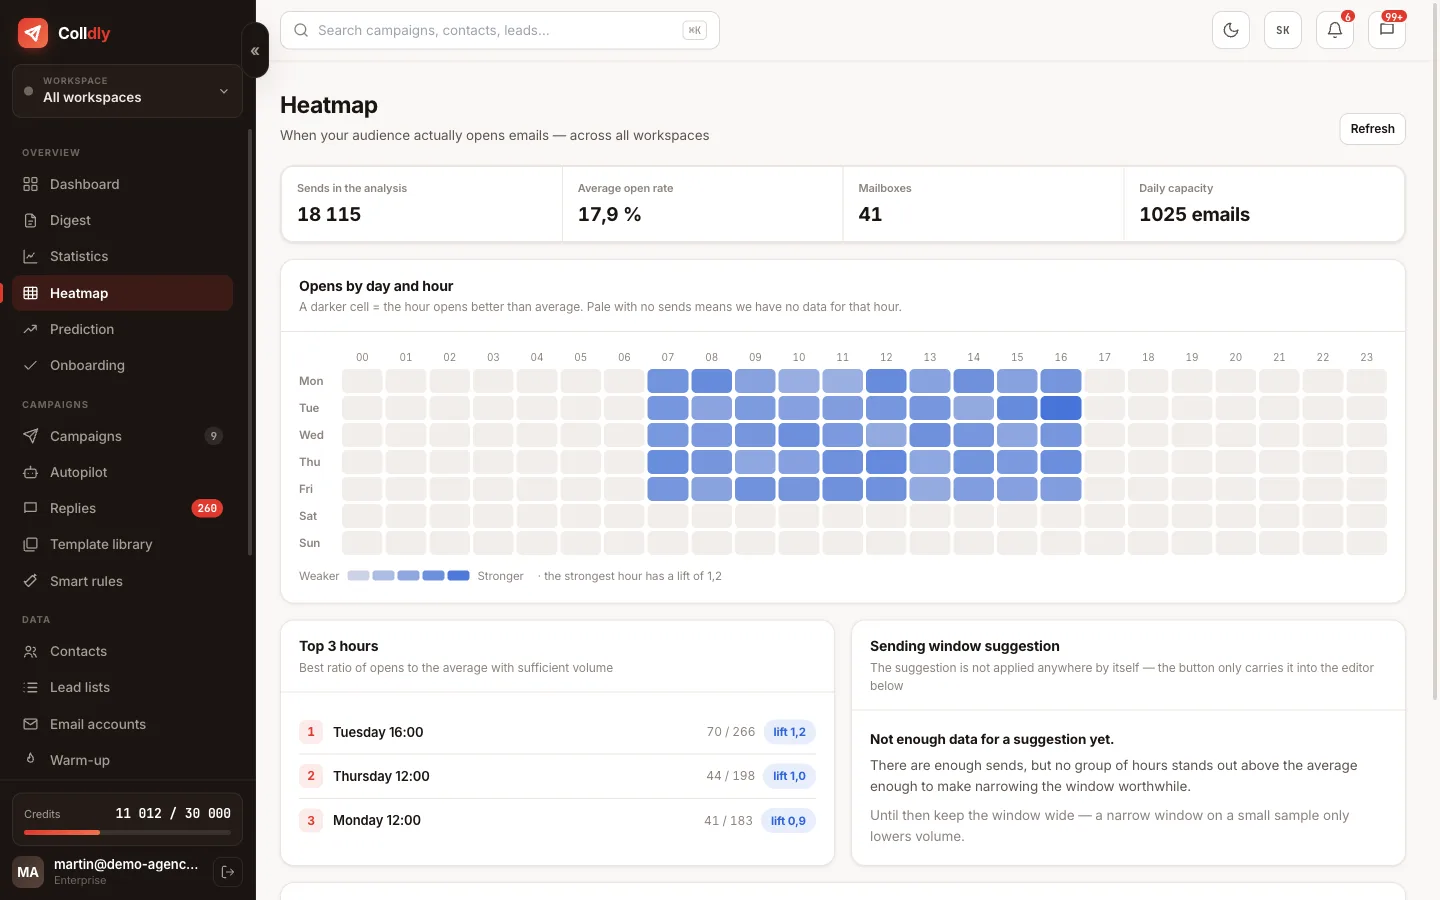
Opens heatmap by day and hour in Colldly
The heatmap shows when your target group reads email; set the sending window by it.

Performance by sequence step

The summary number for a campaign hides the most interesting part. When you split the results by sequence step, you find out where the business really happens.

A typical finding: the first email has a decent open rate but few replies, while the second and third step bring most of the reactions. That is a signal the sequence works and adding another step pays off.

The opposite finding is just as valuable. When follow-ups bring nothing, that is not a reason to send more of them; it is a reason to rewrite them, because they obviously bring nothing new.
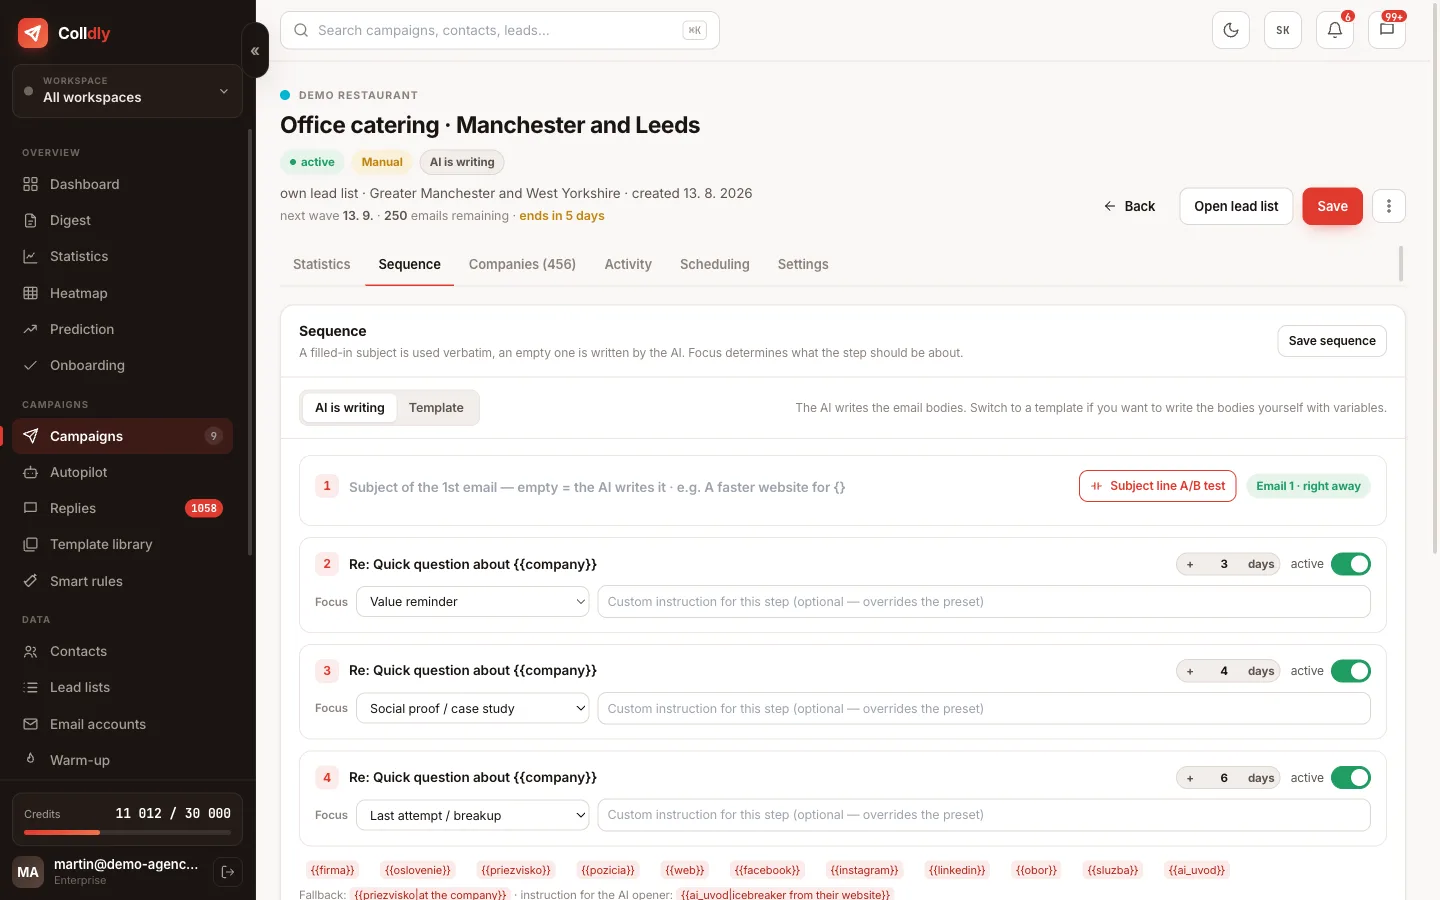
colldly.com/dashboard › Campaigns
Performance per sequence step in the Colldly campaign detail
Every step shows opens and replies, so you know which follow-up brings the results.

Tools beyond the basic numbers

Heatmap
Opens spread by day and hour. It shows when your recipients are at their email, and you set the sending window accordingly.
Load forecast
An estimate of how many emails go out in the coming days and when the campaign finishes. Useful for planning reply capacity.
Subject line A/B test
Two subject lines head to head with recipients split in half. You see the winner in black and white, no guessing.
Campaign comparison
Two campaigns side by side. It quickly reveals which approach to a segment works better.
Performance by brand
With several workspaces you see the numbers for each brand separately and combined.
Weekly digest
A summary of sending, replies, deliverability and credits by email, without opening the app.
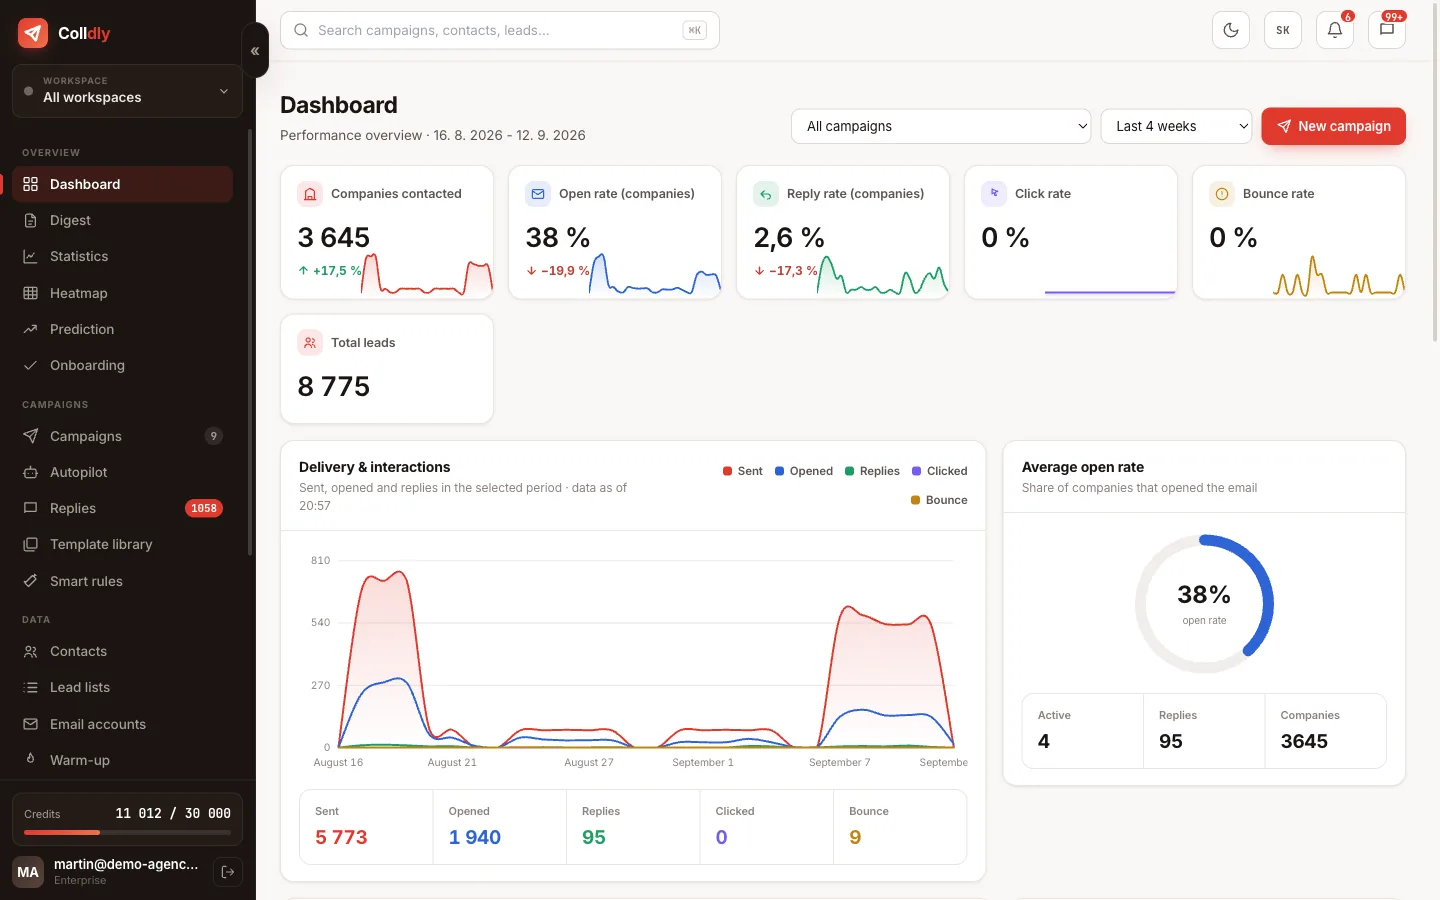
colldly.com/dashboard › Overview
Colldly dashboard with the performance of all campaigns
The dashboard sums up all campaigns in one view: what is running, what gets replies and what needs attention.
Tip: Always change only one thing at a time. When you rewrite the subject line and the copy and change the segment at once, the result tells you nothing; you will not know what worked.

Why open rate is only indicative

An open is measured with an invisible image in the body of the email. When the mail client downloads it, an open is recorded. The problem is that some clients block images automatically and others prefetch them without anyone reading the message.

The result is that the open rate can be both underestimated and overestimated. As a trend over time it is useful; a sharp drop with unchanged copy is a reliable signal of a deliverability problem. As an absolute number, do not rely on it.

A reply, by contrast, is hard data. It either came or it did not.

What this feature does not do

So you know exactly what you are buying: these are deliberate limits, not bugs.

Open rate is an indicative figure because of image blocking and prefetching by mail clients.
We do not measure what happens on your website after a click. That is what website analytics is for.
The forecast is an estimate based on the pace so far. Changing limits or adding mailboxes shifts it.
Statistics do not replace a CRM with a sales funnel. They track the campaign up to the reply, not the closing of the deal.

Frequently asked questions

What open rate is good for cold email?

Above forty percent is a solid result, above sixty excellent. It depends on list quality, the subject line and mailbox warm-up.

Why do I have a high open rate and zero replies?

The subject line attracts, but the copy does not deliver value or the call to action is unclear. Try rewriting the body of the email and simplifying what you ask for.

Can I see exactly who opened the email?

Yes, for each company you see the number of opens and the time of the last one. Companies that opened repeatedly are the warmest contacts.

How do I run a subject line A/B test?

In the campaign settings add a second subject line. Recipients are split in half and after a few days you see which one has the higher open rate.

Can I measure without a tracking pixel?

Opens cannot be measured without it, but replies and bounces can. Those are more important anyway.

Related guides

Related features
Start today

Launch your first campaign this week.

200 trial credits, no card and no commitment. Your first campaign is live in 10 minutes and the first replies usually arrive within 48 hours.

Start for free
No credit card · First 200 credits free · Cancel anytime